Pivoting Data
In SQL, pivoting data is used to transform rows of data into columns. The process involves aggregating data from multiple rows into a single row with multiple columns. This can be useful for displaying data in a more concise and understandable format.
Pivoting is often used with the SQL GROUP BY clause, which groups rows with the same value in one or more columns.
Here is an example of how pivoting data can be used in SQL:
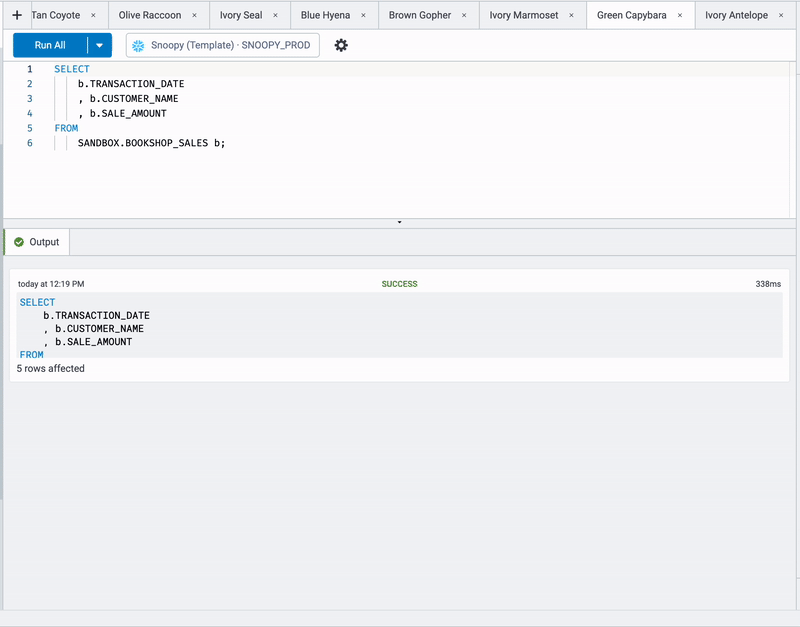
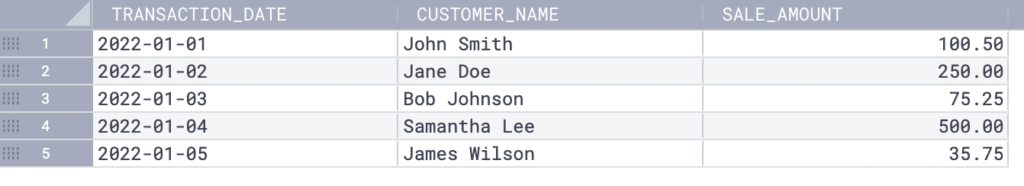
Suppose you have a table called bookshop_sales that contains data about sales transactions. Each table row represents a single transaction, with columns for the transaction date, the customer name, and the sale amount.
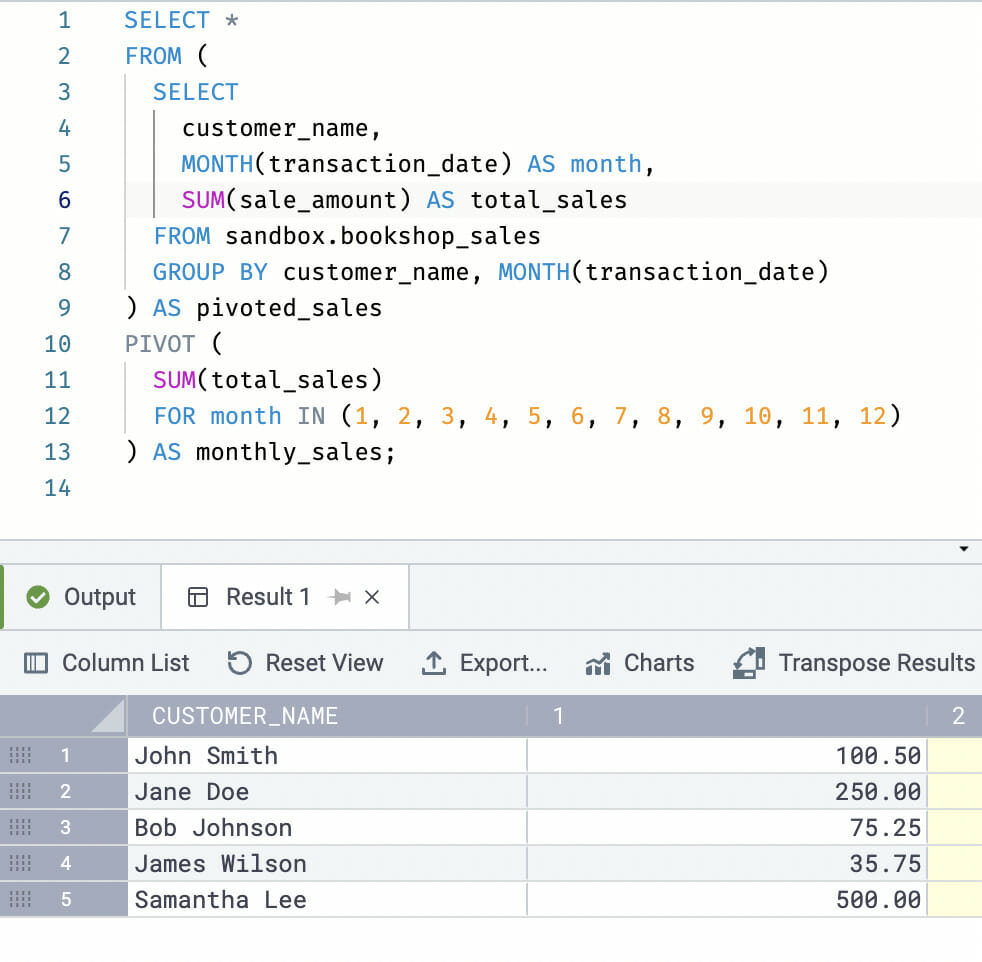
To pivot the data in this table, you might want to transform the rows into columns showing each customer’s total sales, broken down by month.
Here’s how you could do that:
SELECT *FROM (
SELECT	customer_name,
  MONTH(transaction_date) AS month,
  SUM(sale_amount) AS total_sales
 FROM bookshop_sales
 GROUP BY customer_name, MONTH(transaction_date)
) AS pivoted_sales
PIVOT (
 SUM(total_sales)
 FOR month IN (1, 2, 3, 4, 5, 6, 7, 8, 9, 10, 11, 12)
) AS monthly_sales
In this example, the SELECT statement inside the subquery groups the sales data by customer name and month, and calculates the total sales for each combination of customer and month. The PIVOT clause then transforms the result set into a table with one row for each customer, and columns for each month of the year, showing the total sales for each customer.
Pivoting Data in Coginiti
In Coginiti, you can use the Pivot Mode in the Grid View and drag and drop the values you want to pivot. Here’s how you do it:
1 – Open your table
2 – Select the View Mode
3 – Click on “Columns” and activate the Pivot Mode
4 – Drag and drop the values you want to pivot.