A Quick Guide to Pivoting Data
This is an introductory level guide that breaks down how to rearrange data and get more from data analysis.
A pivot table is a powerful tool in a business setting, as it allows users to reorganize data in different ways to find new information. Pivot tables are commonly used with massive datasets to see a complete or new picture. This article will explain the process of pivoting data and what you can do with pivot queries by showing practical examples using SQL and Coginiti Pivot mode. In Coginiti, you can do it all. To code or not to code? It’s up to you!
Pivoting data is helpful for teams looking for underperforming products, regions or customer segments. Your company can use this information to improve these areas and create new plans to drive better business results.
Table of contents:
Overview of the Pivot Data Function
Pivoting data allows you to rearrange the columns and rows to view data from multiple perspectives. You can work on a spreadsheet or database table. For example, if you need to explore a specific column to understand an issue or create a new subset of data new, you can rotate data using that information as a starting point.
The pivot function rotates a particular column (turning it into a row) and its unique values. It then aggregates the values where required. It also enables you to summarize by categories, expand and collapse levels of data, filter, sort, group, aggregate, and create custom calculations.
How to Work with Pivot Tables
Overall, pivot tables are a powerful tool for summarizing, analyzing, and making sense of large datasets. They can help you better understand your business and make better informed, data-driven decisions.
Summarize Sales Data
Summarize your sales data by product, usage type, time (or any criteria that fit your market). You’ll see how different aspects are related and identify trends and patterns in the data. If you need to understand and investigate your data, looking at it in new ways and subsets can help you to find broad perspectives.
Sorting, Filtering, and Grouping Data
You can sort, filter, and group fields to answer questions or look for solutions. In addition, you can manipulate data individually to hide those you do not want to view. For example, if your sales data includes a PAYMENT field, you can filter to show only the results for a single customer or customers who didn’t pay your monthly fee. It might help you to analyze customer behavior and understand, for example, how to target customers more effectively.
How to Pivot Data
A pivot table has three main components:
- Columns
- Aggregate functions (the most common are sum, average, minimum, and maximum)
- Values
The best way to get actionable insights is by asking the correct data analysis questions. Reorganizing your data to see different possibilities might be necessary to ask smarter questions.
In the following example, we’ll show how to rearrange a data pool so you can see pivoting data in practice.
Our example table consists of four columns:
- TEAM_ID
- TEAM_NAME
- SALARY_AMOUNT
- MONTH_NAME
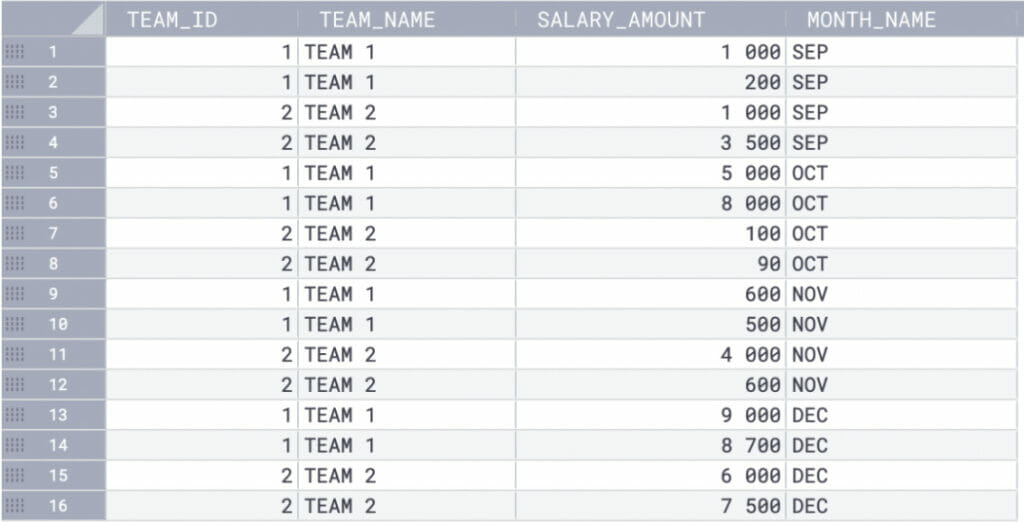 Coginiti Grid View
If you need to know how much your company pays each team per month, you would want to see your data rearranged like this:
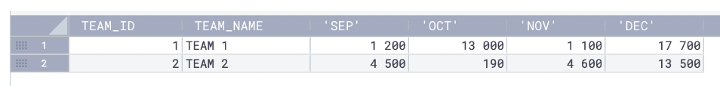
Here’s an example of a query you could write to rearrange your data (using Snowflake syntax):
SELECT *
FROM
SANDBOX.PIVOT_DEMO
PIVOT(SUM(SALARY_AMOUNT) FOR MONTH_NAME IN ('SEP', 'OCT', 'NOV', 'DEC')) AS P
ORDER BY
TEAM_ID;
Another way to play with your data is by using Coginiti Pivot mode. You can drag and drop the columns to find the best result for your analysis. See how it works:
Note: the tool doesn’t change the spreadsheet or database. Instead, it simply “pivots” data to create a different view perspective. The process is handy when working with large quantities of data that would be time-consuming to calculate manually.